Specialized code to help you debug your code is really helpful. You should write some.
Debugging in the coverage.py code can be difficult, so I’ve written a lot of helper code to support debugging. I just added some more.
These days I’m working on adding support in coverage.py for sys.monitoring. This is a new feature in Python 3.12 that completely changes how Python reports information about program execution. It’s a big change to coverage.py and it’s a new feature in Python, so while working on it I’ve been confused a lot.
Some of the confusion has been about how sys.monitoring works, and some was eventually diagnosed as a genuine bug involving sys.monitoring. But all of it started as straight-up “WTF!?” confusion. My preferred debugging approach at times like this is to log a lot of detailed information and then pore over it.
For something like sys.monitoring where Python is calling my functions and passing code objects, it’s useful to see stack traces for each function call. And because I’m writing large log files it’s useful to be able to tailor the information to the exact details I need so I don’t go cross-eyed trying to find the clues I’m looking for.
I already had a function for producing compact log-friendly stack traces. For this work, I added more options to it. Now my short_stack function produces one line per frame, with options for which frames to include (it can omit the 20 or so frames of pytest before my own code is involved); whether to show the full file name, or an abbreviated one; and whether to include the id of the frame object:
_hookexec : 0x10f23c120 syspath:/pluggy/_manager.py:115
                    _multicall : 0x10f308bc0 syspath:/pluggy/_callers.py:77
            pytest_pyfunc_call : 0x10f356340 syspath:/_pytest/python.py:194
    test_thread_safe_save_data : 0x10e056480 syspath:/tests/test_concurrency.py:674
                     __enter__ : 0x10f1a7e20 syspath:/contextlib.py:137
                       collect : 0x10f1a7d70 cov:/control.py:669
                         start : 0x10f1a7690 cov:/control.py:648
                         start : 0x10f650300 cov:/collector.py:353
                 _start_tracer : 0x10f5c4e80 cov:/collector.py:296
                      __init__ : 0x10e391ee0 cov:/pep669_tracer.py:155
                           log : 0x10f587670 cov:/pep669_tracer.py:55
                   short_stack : 0x10f5c5180 cov:/pep669_tracer.py:93
Once I had these options implemented in a quick way and they proved useful, I moved the code into coverage.py’s debug.py file and added tests for the new behaviors. This took a while, but in the end I think it was worth it. I don’t need to use these tools often, but when I do, I’m deep in a bad problem and I want to have a well-sharpened tool at hand.
Writing debug code is like writing tests: it’s just there to support you in development, it’s not part of “the product.” But it’s really helpful. You should do it. It could be something as simple as a custom __repr__ method for your classes to show just the information you need.
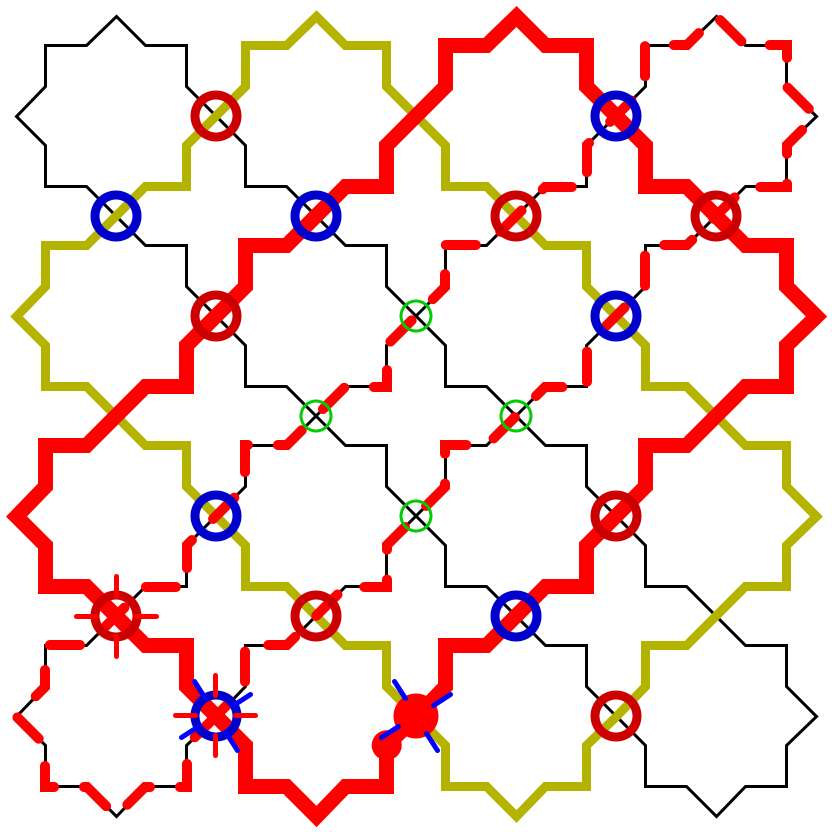
It’s especially helpful when your code deals in specialized domains or abstractions. Your debugging code can speak the same language. Zellij was a small side project of mine to draw geometric art like this:

When the over-under weaving code wasn’t working right, I added some tooling to get debug output like this:

I don’t remember what the different colors, patterns, and symbols meant, but at the time it was very helpful for diagnosing what was wrong with the code.
Comments
Add a comment: