Saturday 29 October 2016 — This is more than nine years old. Be careful.
UPDATE (Feb 2024): the latest version of this notebook is at Updated multi-parameter interactive Jupyter notebook.
I’m working on figuring out retirement scenarios. I wasn’t satisfied with the usual online calculators. I made a spreadsheet, but it was hard to see how the different variables affected the outcome. Aha! This sounds like a good use for a Jupyter Notebook!
Using widgets, I could make a cool graph with sliders for controlling the variables, and affecting the result. Nice.
But there was a way to make the relationship between the variables and the outcome more apparent: choose one of the variables, and plot its multiple values on a single graph. And of course, I took it one step further, so that I could declare my parameters, and have the widgets, including the selection of the variable to auto-slide, generated automatically.
I’m pleased with the result, even if it’s a little rough. You can download retirement.ipynb to try it yourself.
The general notion of a declarative multi-parameter model with an auto-slider is contained in a class:
%pylab --no-import-all inline

from collections import namedtuple

from ipywidgets import interact, IntSlider, FloatSlider

class Param(namedtuple('Param', "default, range")):
    """
    A parameter for `Model`.
    """
    def make_widget(self):
        """Create a widget for a parameter."""
        is_float = isinstance(self.default, float)
        is_float = is_float or any(isinstance(v, float) for v in self.range)
        wtype = FloatSlider if is_float else IntSlider
        return wtype(
            value=self.default,
            min=self.range[0], max=self.range[1], step=self.range[2],
            continuous_update=True,
        )

class Model:
    """
    A multi-parameter model.
    """

    output_limit = None
    num_auto = 7

    def _show_it(self, auto_param, **kw):
        if auto_param == 'None':
            plt.plot(self.inputs, self.run(self.inputs, **kw))
        else:
            autop = self.params[auto_param]

            auto_values = np.arange(*autop.range)
            if len(auto_values) > self.num_auto:
                lo, hi = autop.range[:2]
                auto_values = np.arange(lo, hi, (hi-lo)/self.num_auto)
            for auto_val in auto_values:
                kw[auto_param] = auto_val
                output = self.run(self.inputs, **kw)
                plt.plot(self.inputs, output, label=str(auto_val))
            plt.legend(loc='center left', bbox_to_anchor=(1, 0.5))
        if self.output_limit is not None:
            plt.ylim(*self.output_limit)

    def interact(self):
        widgets = {
            name:p.make_widget() for name, p in self.params.items()
        }
        param_names = ['None'] + sorted(self.params)
        interact(self._show_it, auto_param=param_names, **widgets)
To make a model, derive a class from Model. Define a dict called params as a class attribute. Each parameter has a default value, and a range of values it can take, expressed (min, max, step):
class Retirement(Model):
    params = dict(
        invest_return=Param(3, (1.0, 8.0, 0.5)),
        p401k=Param(10, (0, 25, 1)),
        retire_age=Param(65, (60, 75, 1)),
        live_on=Param(100000, (50000, 150000, 10000)),
        inflation=Param(2.0, (1.0, 4.0, 0.25)),
        inherit=Param(1000000, (0, 2000000, 200000)),
        inherit_age=Param(70, (60, 90, 5)),
    )
Your class can also have some constants:
start_savings = 100000
salary = 100000
socsec = 10000
Define the inputs to the graph (the x values), and the range of the output (the y values):
inputs = np.arange(30, 101)
output_limit = (0, 10000000)
Finally, define a run method that calculates the output from the inputs. It takes the inputs as an argument, and also has a keyword argument for each parameter you defined:
def run(self, inputs,
    invest_return, p401k, retire_age, live_on,
    inflation, inherit, inherit_age
):
    for year, age in enumerate(inputs):
        if year == 0:
            yearly_money = [self.start_savings]
            continue

        inflation_factor = (1 + inflation/100)**year
        money = yearly_money[-1]
        money = money*(1+(invest_return/100))
        if age == inherit_age:
            money += inherit
        if age <= retire_age:
            money += self.salary * inflation_factor *(p401k/100)
        else:
            money += self.socsec
            money -= live_on * inflation_factor
        yearly_money.append(money)

    return np.array(yearly_money)
To run the model, just instantiate it and call interact():
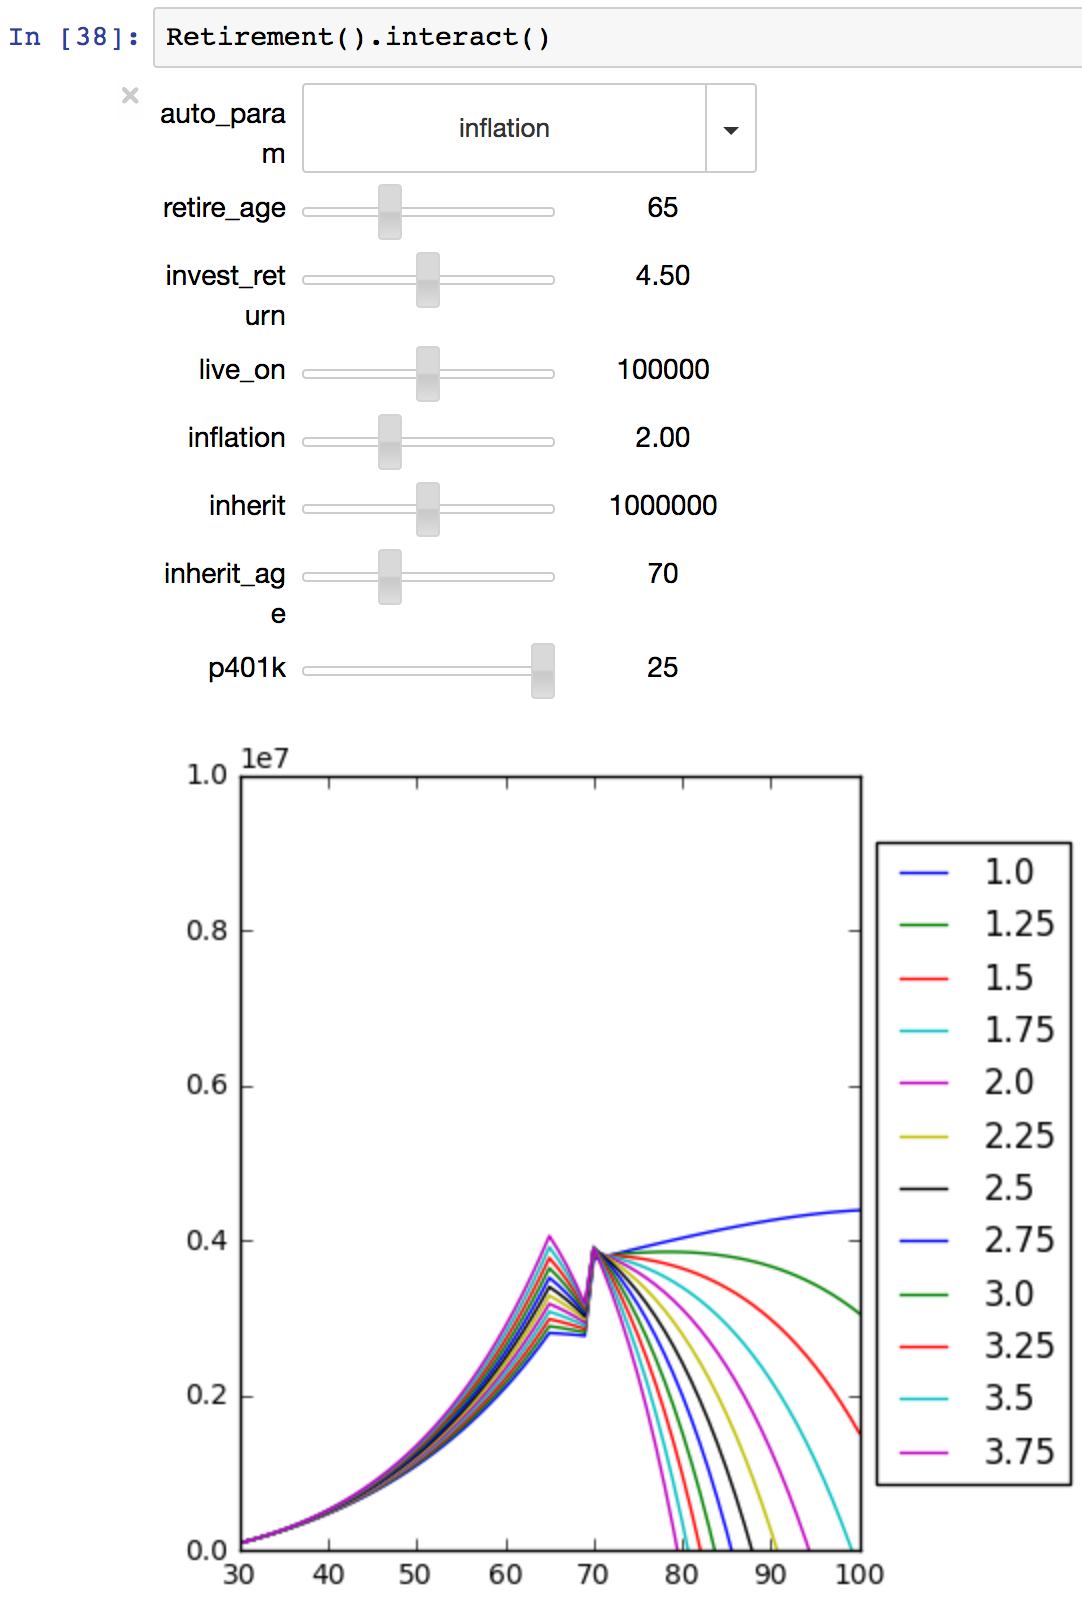
Retirement().interact()
You’ll get widgets and a graph like this:

There are things I would like to be nicer about this:
- The sliders are a mess: if you make too many parameters, the slider and the graph don’t fit on the screen.
- The values chosen for the auto parameter are not “nice”, like tick marks on a graph are nice.
- It’d be cool to be able to auto-slide two parameters at once.
- The code isn’t packaged in a way people can easily reuse.
I thought about fixing a few of these things, but I likely won’t get to them. The code is here in this blog post or in the notebook file if you want it. Ideas welcome about how to make improvements.
BTW: my retirement plans are not based on inheriting a million dollars when I am 70, but it’s easy to add parameters to this model, and it’s fun to play with...
Comments
(I'm also certain you'll continue coding :)
Add a comment: