Aptus
Created 10 October 2007, last updated 14 November 2010
This page is about an outdated version of Aptus. Instead you should read about the latest version, Aptus v3.
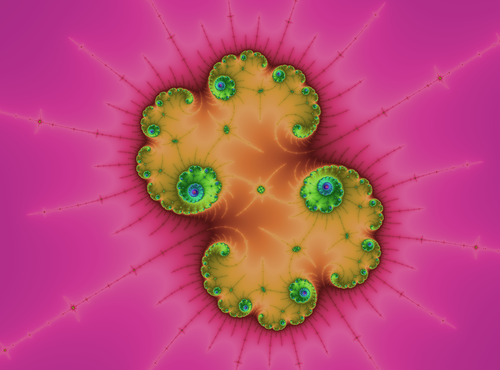
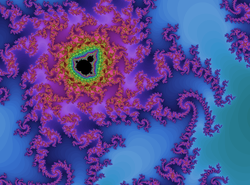
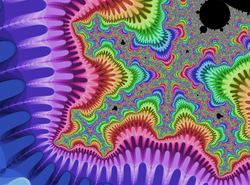
Aptus is a Mandelbrot set viewer and renderer. It is written in Python with a computation engine in C for speed.
Getting Aptus
Pre-requisites
Aptus installs like any other Python package. Before installing Aptus, you’ll need to install these prerequisite Python packages:
- wxPython, 2.8 or greater.
- Numpy.
- Python Imaging Library, 1.1.6 or greater.
Installation
Download the kit that’s right for you. Linux and Mac use the tar.gz, Windows users will probably be happier with the .exe:
Download: Aptus-2.0.tar.gz
Download: Aptus-2.0.win32-py2.5.exe
Install the kit with the usual command:
python setup.py install
Source
The source is available on bitbucket if you prefer direct access to the code, including recent changes.
Using Aptus
There are two ways to use Aptus: a GUI explorer, and a command line renderer. The GUI lets you zoom in and out, and change the color palette to find an image you like. The command line renderer produces higher-quality images.
Parameter files
Aptus stores information about the image to display in a few ways. Small textual .aptus files store all the parameters needed to recreate an image, and can be saved from the GUI and fed to the command line renderer.
When saving an image as a .PNG file, Aptus also stores all its parameter information in a text block hidden in the image, so that the .PNG can be used directly as a parameter file.
Aptus can also read Xaos .xpf files so that you can use Xaos to explore, and Aptus to render if you like.
GUI usage
Start Aptus with aptusgui.py, and start poking around. Left click or drag zooms you in, right click zooms you out. Type ‘h’ for help on other controls. Detailed descriptions of GUI behavior are below.
aptusgui.py also accepts applicable command-line switches so you can start it from a parameter file, or specify the size of the window, and so on.
Command line usage
The command line renderer is called aptuscmd.py. It will accept a number of switches or parameter files:
Usage: aptuscmd.py [options] [parameterfile]

Aptus renders Mandelbrot set images. Two flavors are available: aptusgui.py
for interactive exploration, and aptuscmd.py for high-quality rendering.

Options:
  -h, --help            show this help message and exit
  -a ANGLE, --angle=ANGLE
                        set the angle of rotation
  --center=RE,IM        set the center of the view
  -c, --continuous      use continuous coloring
  --diam=DIAM           set the diameter of the view
  -i ITER_LIMIT, --iterlimit=ITER_LIMIT
                        set the limit on the iteration count
  -o OUTFILE, --output=OUTFILE
                        set the output filename (aptuscmd.py only)
  --phase=PHASE         set the palette phase
  --pscale=SCALE        set the palette scale
  -s WIDxHGT, --size=WIDxHGT
                        set the pixel size of the image
  --super=S             set the supersample rate (aptuscmd.py only)
GUI controls
The Aptus GUI is very bare: there’s just an image of the Mandelbrot set, with no visible controls. You use the mouse and keyboard to control Aptus.
Moving around
Left-clicking zooms into the set, right-clicking zooms out; clicking while holding the Ctrl (or Cmd) key zooms just a little bit. If you drag out a rectangle with the left mouse button, you will zoom into that rectangle, so you have more control over exactly where you end up.
If you drag with the middle mouse button, you will drag the image, re-centering it on a new point of interest.
The ‘a’ key will prompt you for a new angle of rotation for the image.
The ‘n’ key will open a new top-level window to explore elsewhere in the set.
Appearance
The image of the Mandelbrot set is drawn by calculating a value at each pixel, then mapping that value to a color through a palette. The values can be discrete or continuous — use the ‘c’ key to toggle between the two.
The accuracy of the black boundary of the set depends on the number of iterations Aptus is permitted to calculate at each point. The value can be adjusted with the ‘i’ key.
Aptus has handful of different palettes. Cycle through them with the ‘<’ (less-than) and ‘>’ (greater-than) keys. A list of all the palettes can be displayed with ‘p’. The color mapped to each value can be shifted one color with the ‘,’ (comma) and ‘.’ (period) keys. If the pixel values are continuous, then the palette can also be scaled to change the distance between color bands — use the ‘;’ (semicolon) and “’” (apostrophe) keys, optionally with the Ctrl key to change just a little.
The hue and saturation of the palette can also be shifted. The ‘[‘ and ‘]’ (square bracket) keys change the hue, and ‘{‘ and ‘}’ (curly braces) change the saturation. Both also use the Ctrl key to change just a little.
The ‘0’ (zero) key will reset all palette adjustments.
Auxiliary windows
Aptus has a few tool windows. Each is toggled with a particular key.
‘p’ displays a list of all Aptus’ palettes. Clicking one will change the display to use it.
‘v’ displays a list of statistics about the last fractal calculation.
‘q’ displays information about a point in the display. Hold the shift key and hover over a point in the image to see iteration counts, coordinates, and so on.
‘l’ (lowercase L) displays the You Are Here panel. It shows a series of images, zooming in to the currently displayed view of the set. Each image has a rectangle drawn on it corresponding to the next image in the list, so that you can see how your close-up view in the main window relates to the larger set. Any rectangle can be dragged to change the main window’s view of the set.
Julia set
The Julia set is closely related to the Mandelbrot set. Each point in the Mandelbrot set corresponds to a Julia set. To display the Julia set, use the ‘J’ key (with the shift key). A small tool window appears. It shows the Julia set for the current shift-hovered point in the main window. Hold the shift key and move the mouse over the Mandelbrot set. The Julia set will change as the mouse moves.
To further explore a particular Julia set, double-click in the Julia set window. You’ll get a new top-level window displaying the Julia set, and you can use all the usual Aptus controls to navigate and manipulate the image.
History
Version 2.0, October 2008
- Multiple top-level exploration windows.
- Tool panels show supplementary information:
- You Are Here shows your location in the Mandelbrot set.
- Palettes panel shows all the palettes, and the one currently in use.
- Statistics panel shows statistics about the latest computation.
- Point Info panel shows information about the current point, shift-hover to indicate point.
- Julia panel shows Julia set for the current point, shift-hover to indicate point. Double-clicking the Julia panel opens a new exploration window to explore that Julia set.
- Computation improvements:
- Faster.
- The exploration window updates during computation.
- Continuous coloring is more accurate now: banding artifacts are gone.
- When dragging the exploration window, pixels still in the window aren’t re-calculated.
- Center and diameter can be specified in the command line arguments.
Version 1.56, April 2008
More display improvements and simplifications. Thanks, Paul Ollis.
Version 1.55, April 2008
The display is now flicker-free. Thanks, Rob McMullen.
Version 1.51, March 2008
Fixed a few bugs, including not drawing at all on Mac or Linux!
Version 1.5, March 2008
A number of improvements:
- Continuous coloring.
- Arbitrary rotation support.
- Middle mouse button drags the image.
- Palette tweaking:
- Hue and saturation adjustments.
- Scaling the palette to adjust distance between colors.
- Statistics:
- More statistics: boundaries traced, boundaries filled, and points computed.
- Statistics are written into the final .PNG files.
- Reads .xet files from servebeer.com.
- Some old .aptus files recorded the y coordinate incorrectly, and will now render upside-down: negate the y component of the center to fix this.
Version 1.0, October 2007
First version.
More samples
See also
- Xaos, a full-featured fractal explorer which has many more rendering and fractal options than Aptus.
- Gnofract 4D, a Linux-based fractal exploration program.
- My blog, where recreational math and Python topics intersect from time to time.


Comments
Add a comment: